Field Guides / Observability with Prometheus, Grafana and OpenTelemetry
Field Guide · Intermediate to Advanced · 12-16 hours with labsObservability on Kubernetes
Build a Prometheus, Grafana and OpenTelemetry stack on kind, and learn to alert, trace and debug like a senior SRE.
90
pages
pages
12
hands-on labs
hands-on labs
30
interview Q&As
interview Q&As
13
chapters
chapters
This is for you if
- You run kube-prometheus-stack but your alerts are noisy and your dashboards don't answer questions
- You want traces and logs that actually link to your metrics during an incident
- You're preparing for SRE, platform or DevOps interviews where observability comes up in every loop
- You need to get monitoring costs and Prometheus memory under control
What's inside
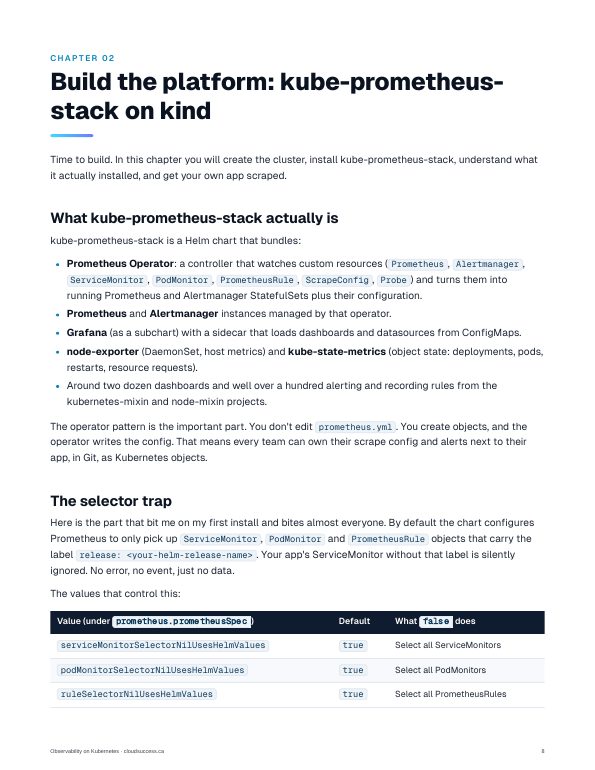
- kube-prometheus-stack on kind, including the selector trap that silently ignores your ServiceMonitors
- The PromQL that matters: rate, aggregation order, histogram_quantile interpolation, RED and USE queries, joins
- Recording and alerting rules as PrometheusRules, unit tested with promtool, with tested example files
- Alertmanager routing, grouping, inhibition and silences, plus a practical philosophy for alerts that don't page for nothing
- Grafana dashboards as code with the sidecar, stable UIDs and recording-rule panels
- OpenTelemetry Operator auto-instrumentation and a hand-built Collector pipeline with Kubernetes metadata
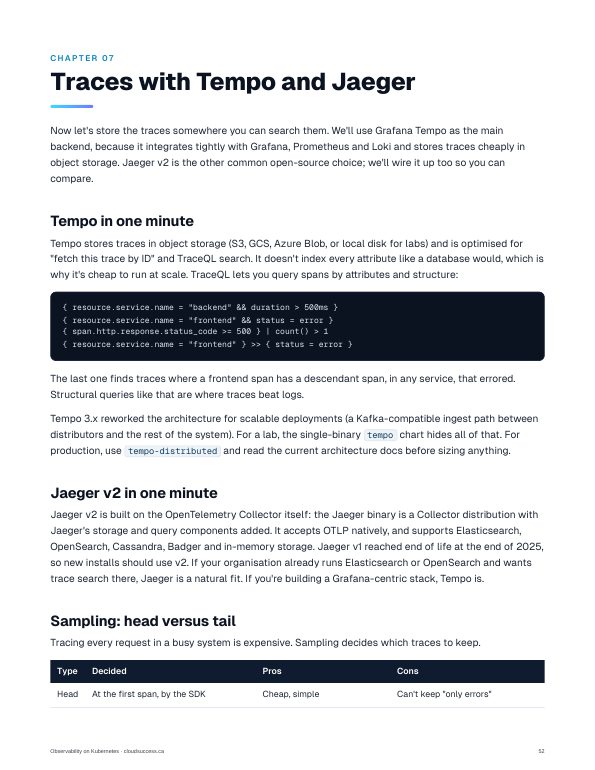
- Tempo (and Jaeger v2) with span metrics computed before tail sampling, and exemplars into Prometheus
- Loki with Grafana Alloy, LogQL, and full metrics-to-traces-to-logs correlation
- Cardinality and cost control: finding offenders, relabel drops, sample limits, retention tiers
After this guide you can
- Stand up a complete metrics, logs and traces platform on Kubernetes from scratch
- Write correct PromQL for RED, USE and latency SLOs, and explain why the wrong versions lie
- Design, test and route alerts that page only for real user impact
- Auto-instrument services with OpenTelemetry and correlate a latency spike to the exact trace and log lines
- Find and defuse a cardinality explosion before it takes Prometheus down
- Answer senior-level observability interview questions with confidence
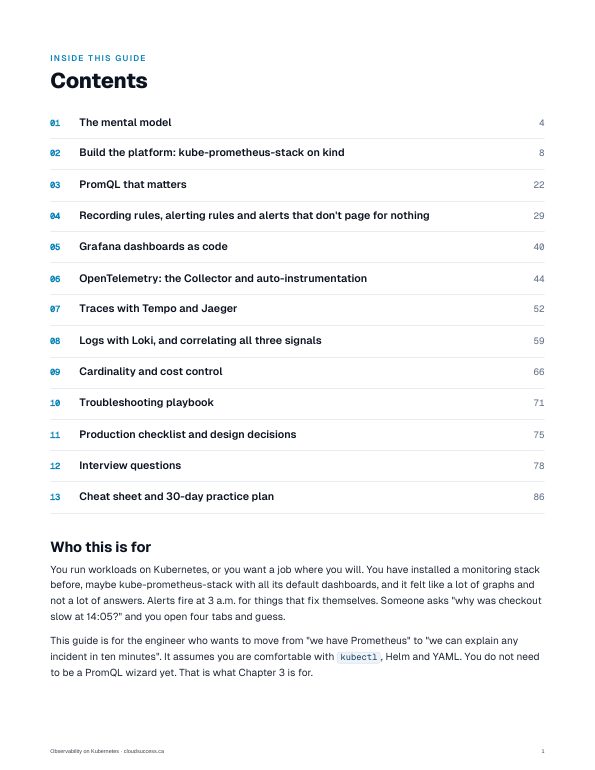
Contents
- The mental modelp. 4
- Build the platform: kube-prometheus-stack on kindp. 8
- PromQL that mattersp. 22
- Recording rules, alerting rules and alerts that don't page for nothingp. 29
- Grafana dashboards as codep. 40
- OpenTelemetry: the Collector and auto-instrumentationp. 44
- Traces with Tempo and Jaegerp. 52
- Logs with Loki, and correlating all three signalsp. 59
- Cardinality and cost controlp. 66
- Troubleshooting playbookp. 71
- Production checklist and design decisionsp. 75
- Interview questionsp. 78
- Cheat sheet and 30-day practice planp. 86
Written by Randy, a Senior Platform Engineer & SRE who runs production platforms on AWS, GCP and Azure. Companion to the Techworld with Randy episode Observability with Prometheus, Grafana and OpenTelemetry.